
Analytics
The Reports page shows visitor statistics for each website on your account. HostCraft builds them on the server from your sites' web server access logs using GoAccess, so you do not need to add any tracking script and no visitor data is sent to a third party. Statistics are refreshed about every five minutes.
| Role | Access |
|---|---|
| Account owner | Reports in the sidebar, for every site on the account |
| Sub-user | Reports only with the analytics permission |
| Admin, reseller, mailbox user | No Reports page in their own shell |
Open your statistics
Section titled “Open your statistics”- Open Reports in the sidebar.
- Choose a website in the Site list. The first site is selected by default.
- Choose a period: 24h, 7d (default) or 30d.
If your account has no websites, the page says "No sites to report on". Add a website first.
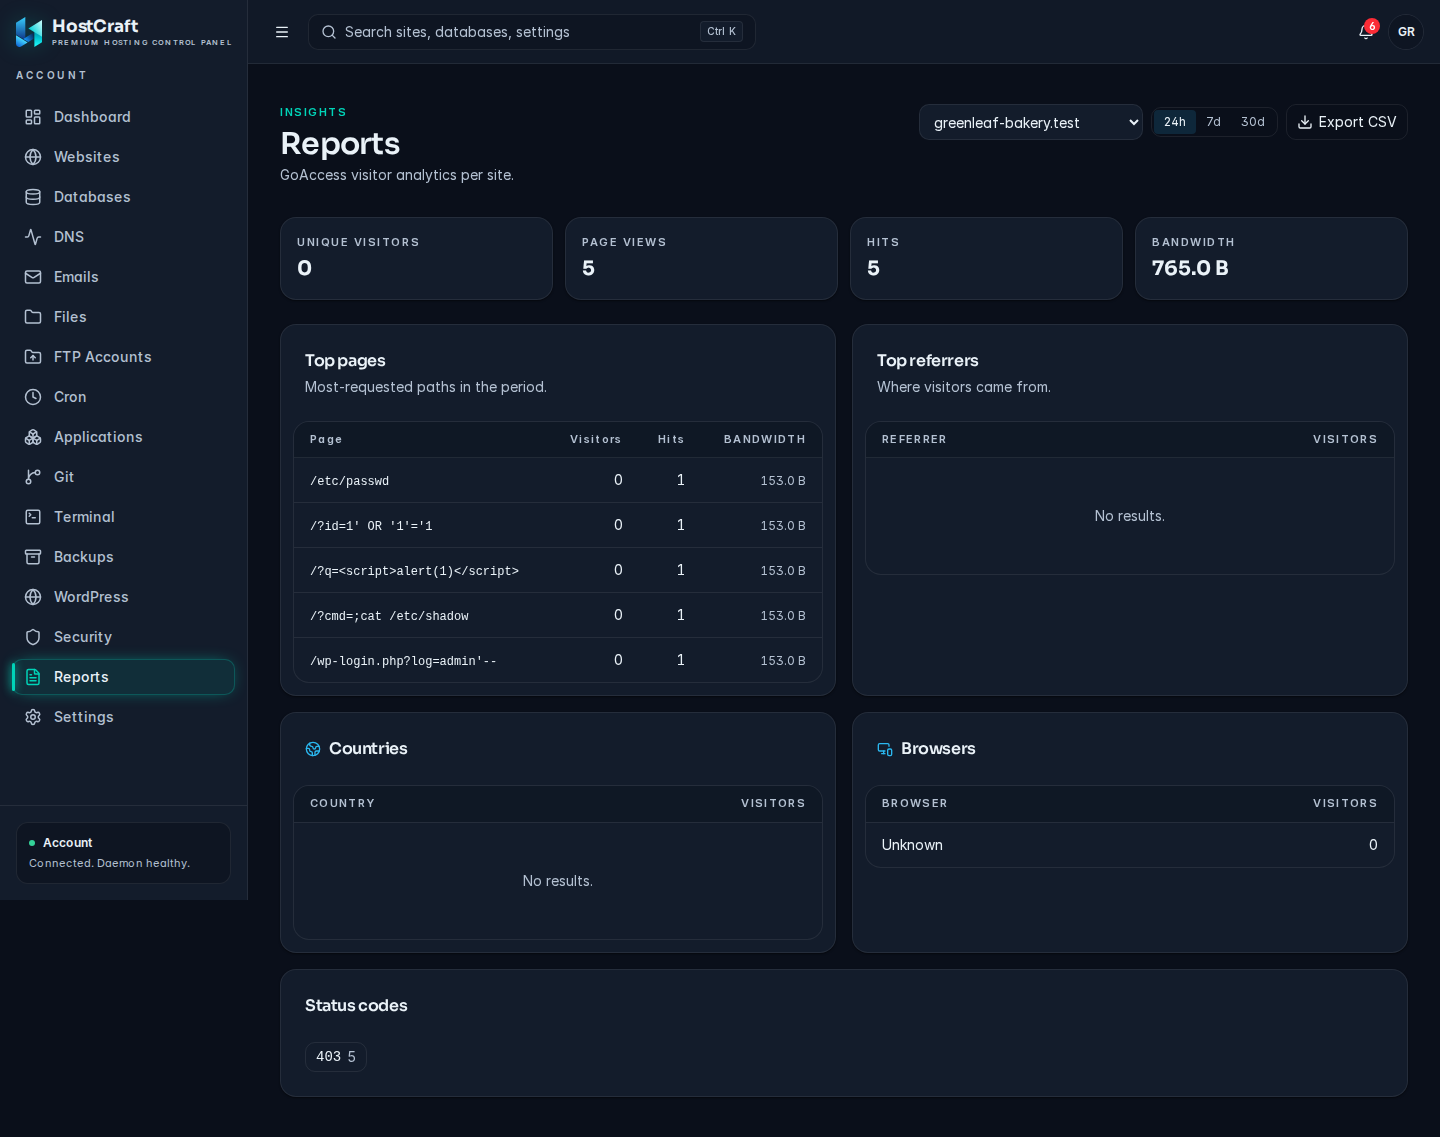
What each section means
Section titled “What each section means”Summary tiles
- Unique visitors: distinct visitors in the period.
- Page views: requests for pages.
- Hits: every request, including images, scripts and stylesheets.
- Bandwidth: data sent to visitors.
Top pages: the most requested paths, with Visitors, Hits and Bandwidth. Click a column header to sort.
Top referrers: where visitors came from (search engines, social sites, other websites), with Visitors.
Countries and Browsers: visitors by country and by browser family.
Status codes: how many hits returned each HTTP status. A rise in 404 points to broken links; a rise in 500 or 502 points to an error in the site.
Export to CSV
Section titled “Export to CSV”Click Export CSV to download analytics-SITE-PERIOD.csv. It contains the summary figures (including not found and failed requests), top pages, referrers, countries, browsers and status codes in one table with the columns section, key, visitors, hits and bandwidth_bytes.
The button waits until every section has loaded. If one fails to load it shows Export failed; reload the page and try again.
Common problems
Section titled “Common problems”| Problem | Fix |
|---|---|
| A new site shows no data | Statistics appear once the site has received traffic and the next refresh has run, usually within five minutes. |
| Numbers differ from Google Analytics | Server logs count every request, including visitors who block scripts and many bots. Script-based tools count only browsers that run JavaScript. Expect higher numbers here. |
| The page shows an error loading statistics | Analytics may not be running on the server. Ask your hosting provider. |
| A site is missing from the Site list | Only sites on your own account are listed. |